How AI Agents Are Replacing Dashboards
Gartner: 40% of enterprise apps will embed AI agents by the end of 2026, up from 5%. Dashboards transform, and hereʼs how.
The business intelligence industry spent thirty years optimizing the dashboard. Better charts. Faster queries. More beautiful visualizations. Drag-and-drop interfaces that let business users build their own reports without knowing SQL. Tableau became a $15 billion company. Looker got acquired by Google for $2.6 billion. The dashboard became the standard interface between data and decision-making in almost every company on earth.
The dashboard had one fatal flaw: it required a human to look at it. And then to understand it. And then to decide what to do. And then to actually do it. Every step in that chain introduced delay, inconsistency, and the possibility of doing nothing at all.
In 2026, the dashboard is not disappearing. But it is being demoted — from the primary interface of enterprise data to the audit trail of what AI agents already decided.
The three-stage BI evolution
Business intelligence has climbed a ladder of analytical ambition for thirty years, described clearly in a 2026 Broadwave analysis of the trend. First: reporting. What happened? Second: analytics. Why did it happen? Third: the current inflection: action. What happens next?
Each stage absorbed the previous one. The shift is not just from passive to active, but from human-executed to AI-executed. Gartner predicts that 40% of enterprise applications will integrate task-specific AI agents by the end of 2026, up from less than 5% in early 2025 — and that by 2028, at least 15% of day-to-day work decisions will be made autonomously by agentic AI, up from effectively zero in 2024. The steepness of that curve is the story.
The shift is driven by a convergence of three forces: large language models crossing a competence threshold for reliable multi-step reasoning; the emergence of semantic layers that allow agents to query business metrics without hallucinating; and enterprise frustration with the fundamental limitation of dashboards — that they surface insights but do not execute them.
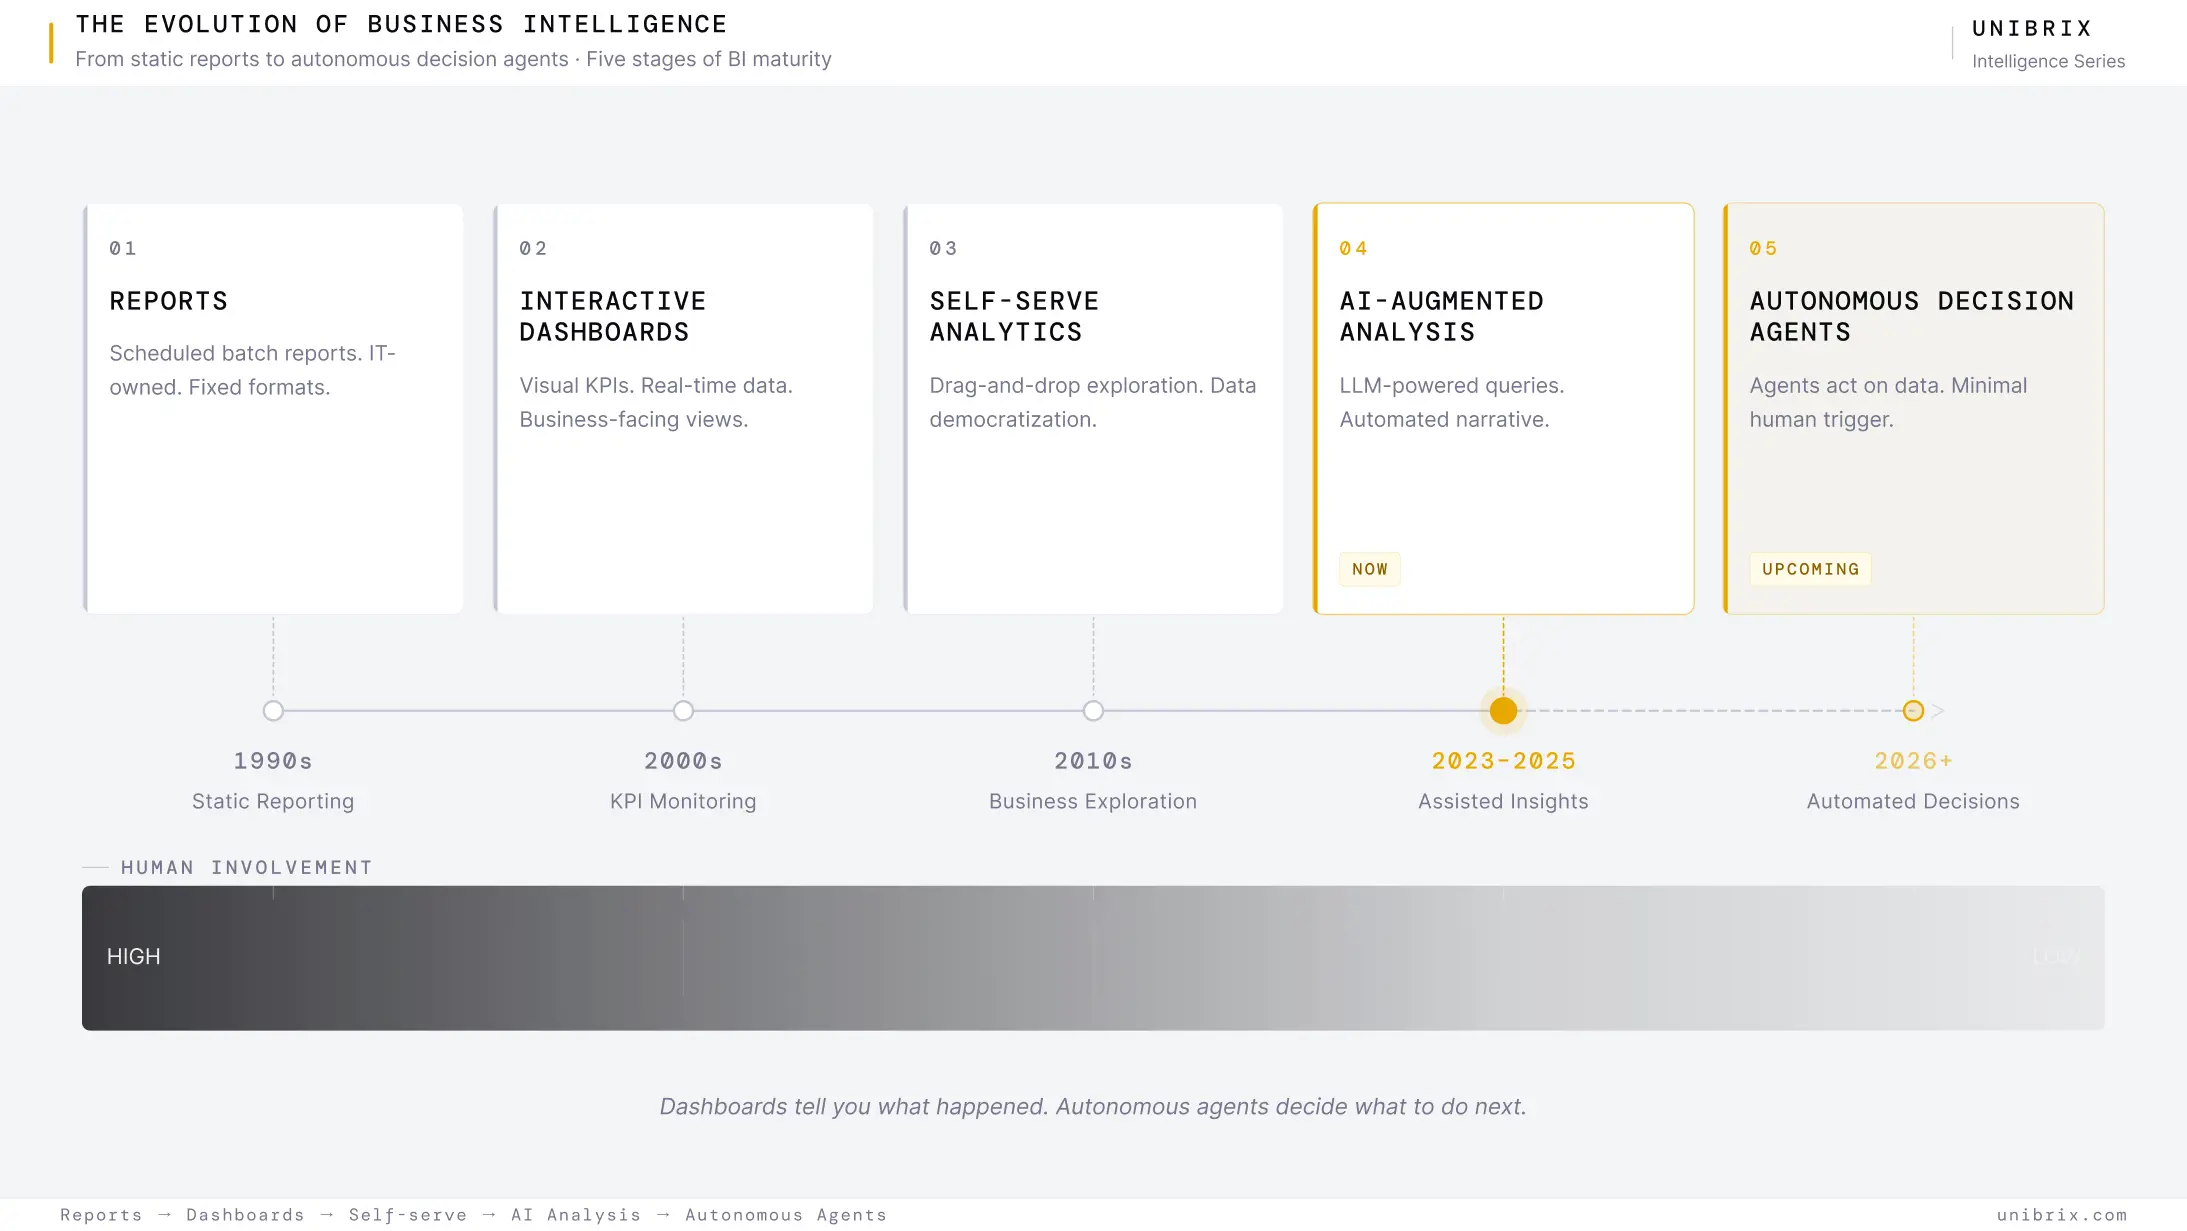
What agents actually do that dashboards donʼt
The distinction matters technically, not just conceptually. A dashboard tells a merchandising manager that a product category is underperforming versus last quarter. An AI agent detects the same anomaly, decomposes it — slicing by segment, geography, channel, and cohort — tests correlations against upstream events, determines whether the anomaly reflects a business change or a data pipeline failure, generates options with quantified trade-offs, and either recommends or (with appropriate guardrails) executes the response.
What used to consume an analystʼs week happens in minutes. According to Apptadʼs analysis of enterprise agentic implementations, decision workflows that previously required multiple human handoffs have been compressed into minutes through AI-driven orchestration, with humans validating exceptions rather than driving routine decisions.
The major BI vendors have read this shift clearly. Tableauʼs 2025-2026 rebrand adds Tableau Agent — an autonomous AI that answers complex multi-step analytical questions by chaining queries, joining data sources, and building visualizations without human intervention. ThoughtSpotʼs Spotter proactively surfaces insights, explains trends, and recommends next questions. Salesforce embedded Einstein agents across CRM workflows; ServiceNow has embedded agentic frameworks across IT operations; Microsoftʼs Copilot for Business Intelligence operates inside Power BI. In each case, the dashboard surface is being augmented — or in some workflows, replaced — by agents that detect, reason, and act.
What the architecture requires
The shift from dashboard to agent is not a UI change. It is a data architecture change. Traditional BI relies on semantic layers that map tables to metrics. Agentic AI requires explicit representation of relationships — customers to contracts, products to suppliers, risks to transactions — so that agents can traverse those relationships and reason beyond predefined queries.
Three architectural requirements stand out for any team building AI agents into their product:
A governed semantic layer — a curated definitions layer where business metrics are defined once and reused across every agent. Agents grounded in semantic layers hallucinate far less than agents pointed at raw tables. A policy and guardrails layer — defining what actions an agent is permitted to take autonomously versus what requires human approval. The Gartner 2026 Hype Cycle for Agentic AI confirms that fully autonomous agents are not yet appropriate for most enterprise use cases; the "human-in-the-loop" hybrid model is the current operating standard. An audit trail — a record of every decision the agent made, the reasoning behind it, and the outcome. In regulated industries, this is a compliance requirement. In all industries, it is how you calibrate trust in the system over time.

The business case for moving now
McKinseyʼs 2025 State of AI report found that 88% of organizations now regularly use AI in at least one business function. The gap is between organizations using AI and organizations using AI to execute decisions. That gap is closing in 2026 — and the organizations that have invested in the underlying data quality and semantic layer work are the ones whose agent deployments are compounding.
Dashboards will not disappear. They document what happened. AI agents determine what happens next.
Building an AI-agent-driven product or analytics layer? Unibrix builds AI-native software systems — including the semantic layers, policy engines, and agent architectures that separate autonomous analytics from expensive demos. The infrastructure decisions that determine whether an AI agent is reliable or unpredictable are made at the architecture stage. → [Talk to Unibrix about building AI-native products]

Moombix

Kennitalan

Wooskill
technical assessment,
and project scoping.
UI/UX design, and
technical specifications.
reviews, and continuous
integration.
testing, security audits,
and bug fixes.
documentation, and
ongoing support.