Back to Cases
#arrow-left

Unibrix

Engineering / Knowledge Base

#menu

Cases / SaaS & Diagnostics / Innovation Train

BLOG_ARCHIVE

#logo
#close
Start building now
#arrow-right
Get in touch
#envelope
LET'S BUILD

Ready to start your project?

Tell us about your challenge. We'll engineer a solution that scales with precision.

We typically respond within 24 hours
Thank you! Your submission has been received!
Oops! Something went wrong while submitting the form.
PROJECT OVERVIEW

Innovation Train

[ INNOVATION DIAGNOSTIC PLATFORM & BOARD-READY REPORTING ]

A research model turned into a product
leaders can act on

CATEGORY
B2B SaaS / Organizational Diagnostics / Research Instrumentation
TIMELINE
March – August 2026
COMPONENTS
Brand identity, marketing site, customer web app, AI-generated diagnostic report system, lifecycle email suite
STATUS
● DELIVERED
SERVICES PROVIDED
Research & Discovery
Product Ideation
Brand Identity
UX/UI Design
Data Visualisation
AI Content Governance
Frontend Development
TECHNOLOGY STACK
Next.js
React
TanStack Query
Paddle
AI / LLM
Google OAuth
GCP Cloud Run
Recharts
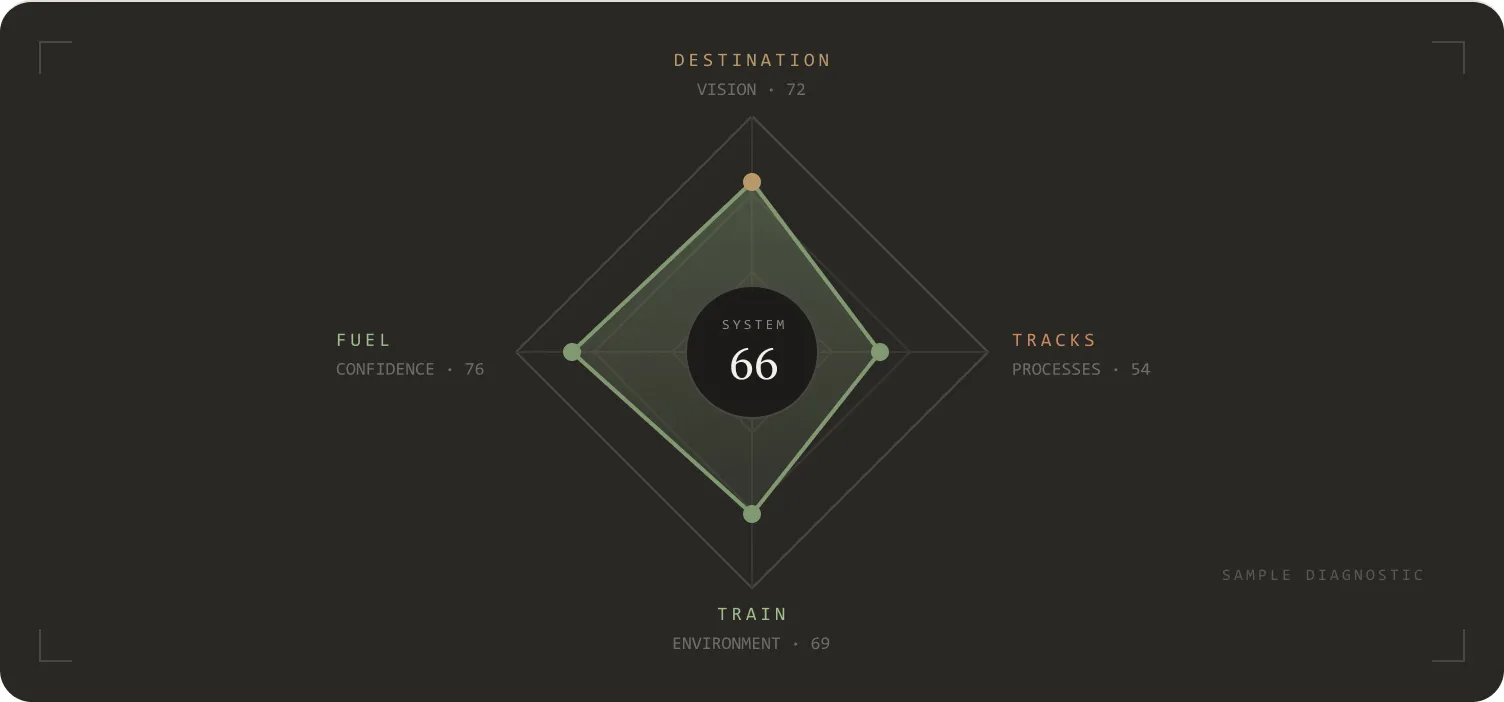
Radar chart showing system score 66 with destination 72, fuel 76, tracks 54, train 69 scores.
01
STEP 01 — Project overview

Assembly Requirements

MODULE INVENTORY (5 COMPONENTS)

Innovation Train is a diagnostic platform that tells an organization where its innovation system is breaking down, before it spends money trying to fix it.

The Innovation Train concept and research framework were created by Birna Dröfn Birgisdóttir and developed through Sköpunargleði ehf. Unibrix translated this framework into the digital product presented in this case study. Learn more at innovationtrain.com.

The framework came out of academic research rather than a product roadmap. Organizations run hackathons, buy idea-management platforms, and commission culture workshops; the energy fades and little changes. The research position is that innovation rarely fails from a shortage of ideas. It fails because the system required to carry an idea forward is incomplete in a specific, findable place.

The model measures four conditions: Station (where innovation should go), Tracks (how ideas move forward), Train (whether the organization supports experimentation) and Fuel (whether employees believe they can contribute). It surveys executives and employees separately, exposing the gap between what leadership believes is true and what staff actually experience, then returns a report naming the constraint.

Unibrix translated the framework into a product: the brand it would be trusted under, the application that runs an assessment, and, most importantly, the report that gets forwarded into a boardroom.

That last part carries an unusual constraint. AI assists with drafting the interpretation, which is reviewed by an expert before delivery. This means the design problem was never only visual. A layout that holds variable prose, a tone that cannot drift, and a clear line between what was measured and what was interpreted all had to be specified before a single client report could ship.

Primary focus
#dot
Turning a research instrument into something a non-analyst can act on
#dot
Designing for a buyer who has to resell the findings to their CEO
#dot
Treating the report, not the dashboard, as the actual product
#dot
Designing a layout that holds machine-written prose without breaking
#dot
Building a visual language that reads as evidence, not as software marketing
#dot
Holding one identity across app, report, deck and inbox
What we delivered
#dot
Brand identity, palette, typography and logo system
#dot
Marketing site with sample-report experience
#dot
Production web application and design system
#dot
18-page diagnostic report — company and department variants
#dot
Slide-scoped report source that generation writes into
#dot
Lifecycle email suite from purchase to report delivery
02
STEP 02 — CHALLENGES IDENTIFIED

Assembly Requirements

MODULE INVENTORY (5 COMPONENTS)
REQUIRED CAPABILITIES
A
#checked
Credibility
The buyer has been burned before by consultants who deliver the same slides to every client. Nothing could look like a template, a startup pitch, or a dashboard skin. The work had to read as an instrument: measured, declarative, and defensible in front of a board.
B
#checked
Translation
Station, Tracks, Train and Fuel arrived as Likert means on a research scale. They had to become scores, comparisons against a benchmark dataset, and plain-language statements about what is actually stuck, readable in minutes by someone who is not a data analyst.
C
#checked
Distribution
The deliverable is a document that leaves the platform. It is projected in a boardroom from three metres away, then skimmed later as a PDF by people who were not in the room. It had to survive both without redesign, and stay consistent with a web app and an inbox rendered by entirely different engines.
C
#checked
Governance
Report prose is generated per client rather than written once. Without hard constraints, generated text overruns a fixed layout, drifts in tone, or invents an attributed quote. The design system had to extend past pixels into the language itself.
03
STEP 03 — ASSEMBLY PROCESS

Solution Architecture

MODULE INVENTORY (5 COMPONENTS)
MODULE 3.1
● Foundational Discovery

We started from the client's research corpus and a set of lo-fi mockups, and produced the artefacts a build could actually run on: a written product requirements document, a primary persona, a route map, and an explicit build-versus-buy position that kept the team from rebuilding commodity infrastructure.

The persona became the tie-breaker for every later decision: a Head of People & Organisational Development who buys the assessment, distributes it, and then has to stand up and explain it.

Quote on decision-making with inputs and outputs lists and build vs buy comparison tables.
MODULE 3.2
● Brand & Design Language

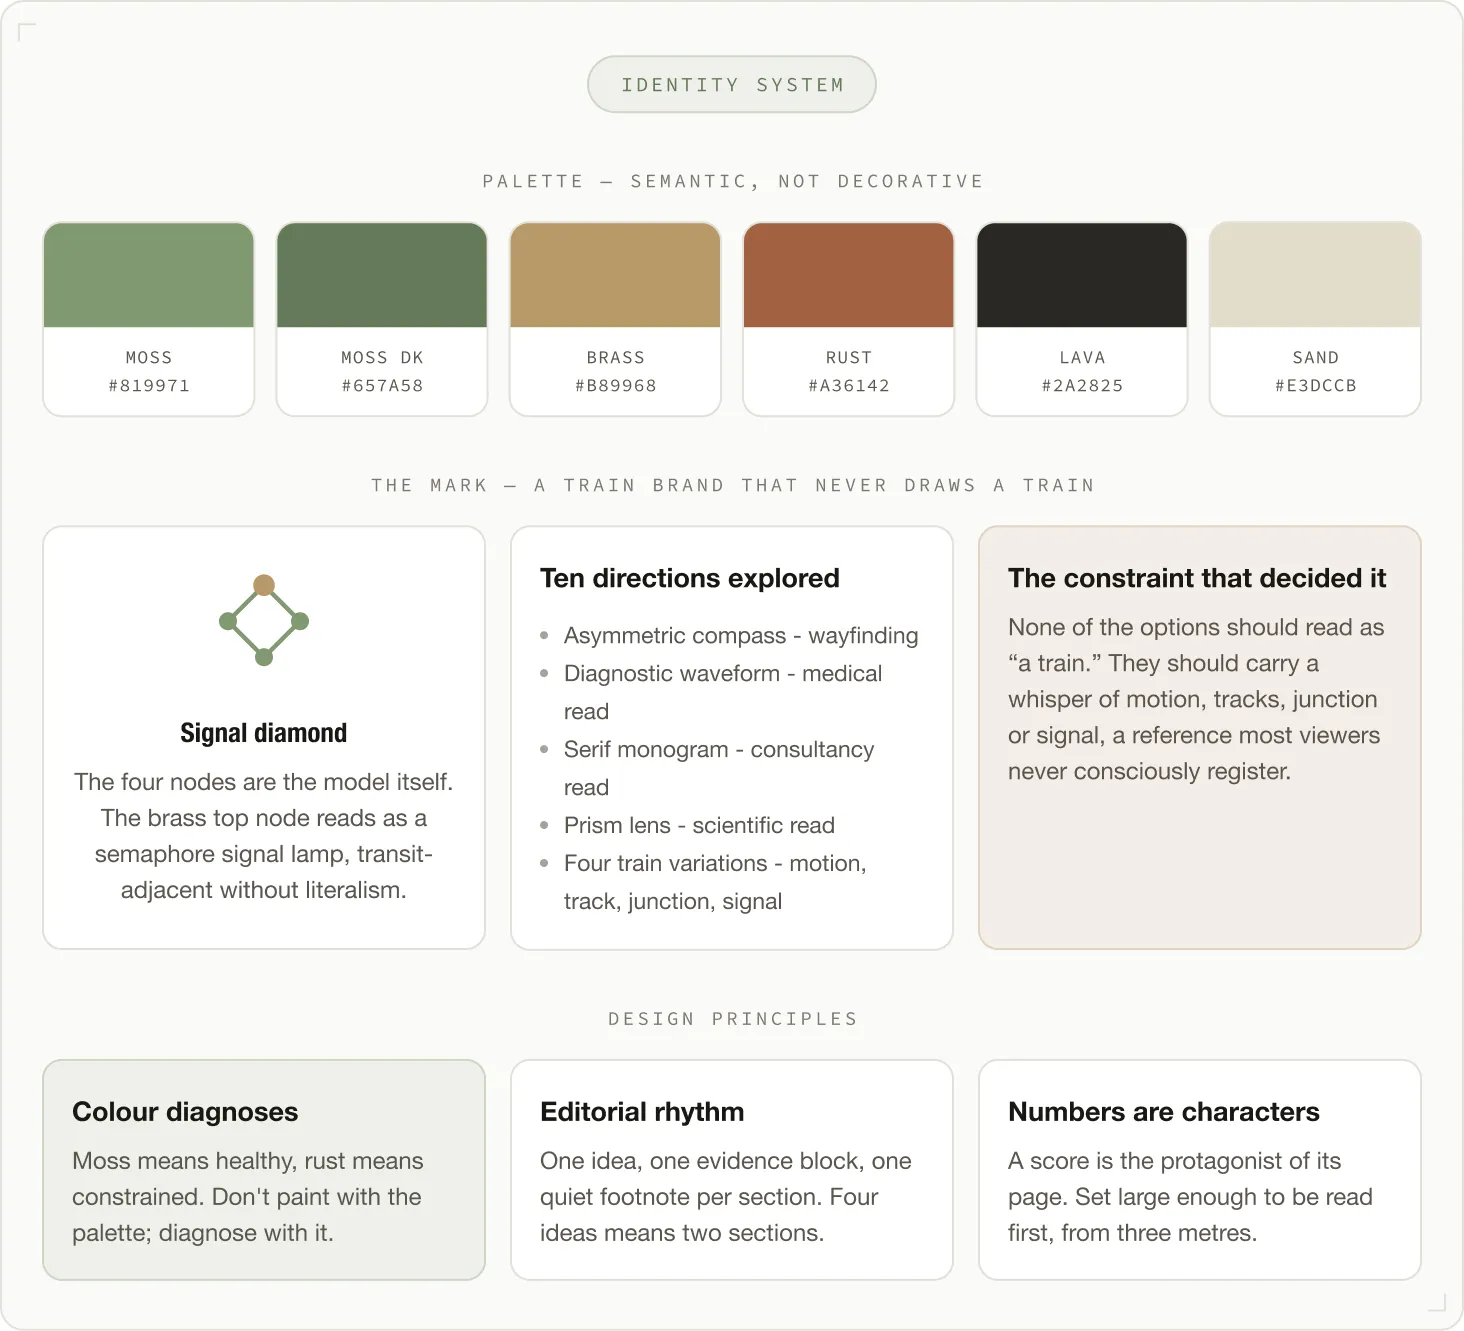
The brand had to signal research credibility to a C-suite audience without borrowing the visual habits of consumer software. We wrote the direction down before drawing it: measured and declarative, closer to an engineering consultancy than a startup. The reference point was a respected mechanic looking under the hood, not a SaaS pitch, and named anti-references kept the work honest.

Colour carries diagnosis rather than decoration: moss marks what is healthy, rust marks what is constrained, brass carries emphasis. A serif display face against a plain grotesque gives the editorial weight of a research publication instead of a product page.

Brand identity system with semantic color palette and design principles focusing on signal diamond and editorial rhythm.
MODULE 3.3
● Report System

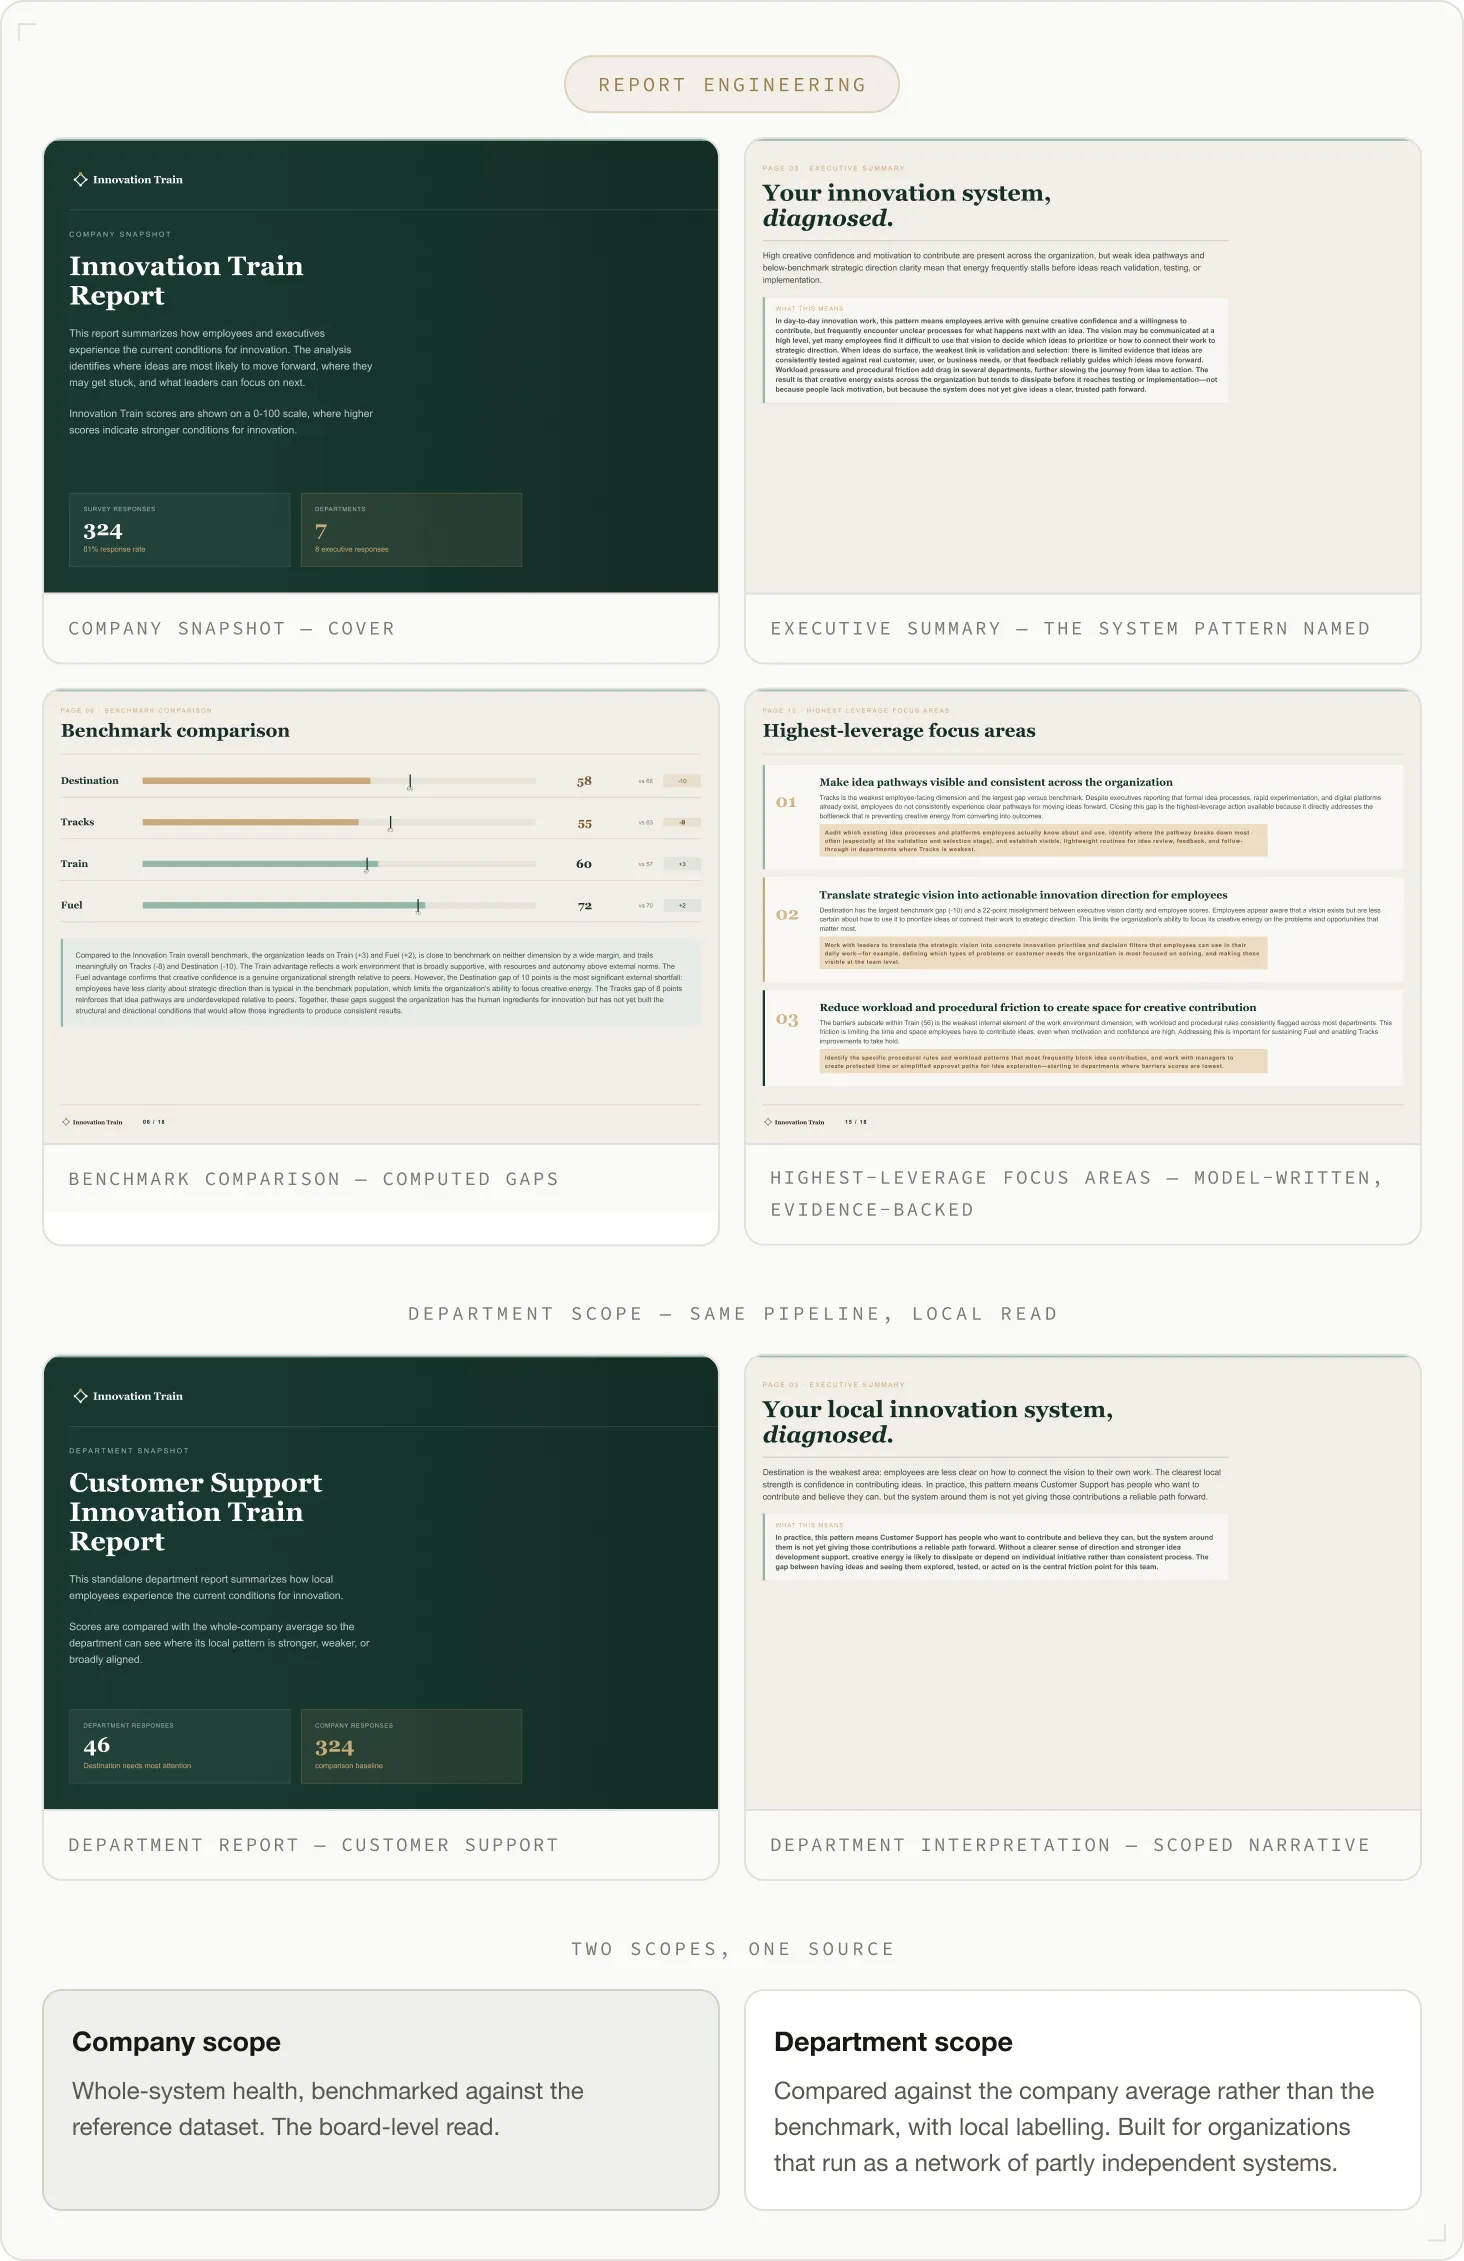
The report is the product. The starting point was a research document assembled in a slide tool: plotting-library charts, default type, findings buried below the fold. We rebuilt it as an eighteen-page system: cover, disclaimer, executive summary, the model, overall profile, benchmark comparison, department comparison, one section per dimension, strengths to protect, gaps, highest-leverage focus areas, a phased action plan, and a closing.

It renders as HTML at slide dimensions so the same source produces a projected deck and a forwarded PDF, with a department-scoped variant for organizations that behave less like one train and more like a railway network.

Report Engineering overview showing Innovation Train report pages: company snapshot with innovation conditions and survey stats; executive summary diagnosing innovation system; benchmark comparison with scores for destination, tracks, train, and fuel; highest-leverage focus areas with actionable strategies; customer support department report highlighting local innovation conditions; department interpretation diagnosing local innovation system; and notes on company versus department scope describing whole-system versus local benchmarking.
MODULE 3.4
● Analysis & Generation Pipeline System

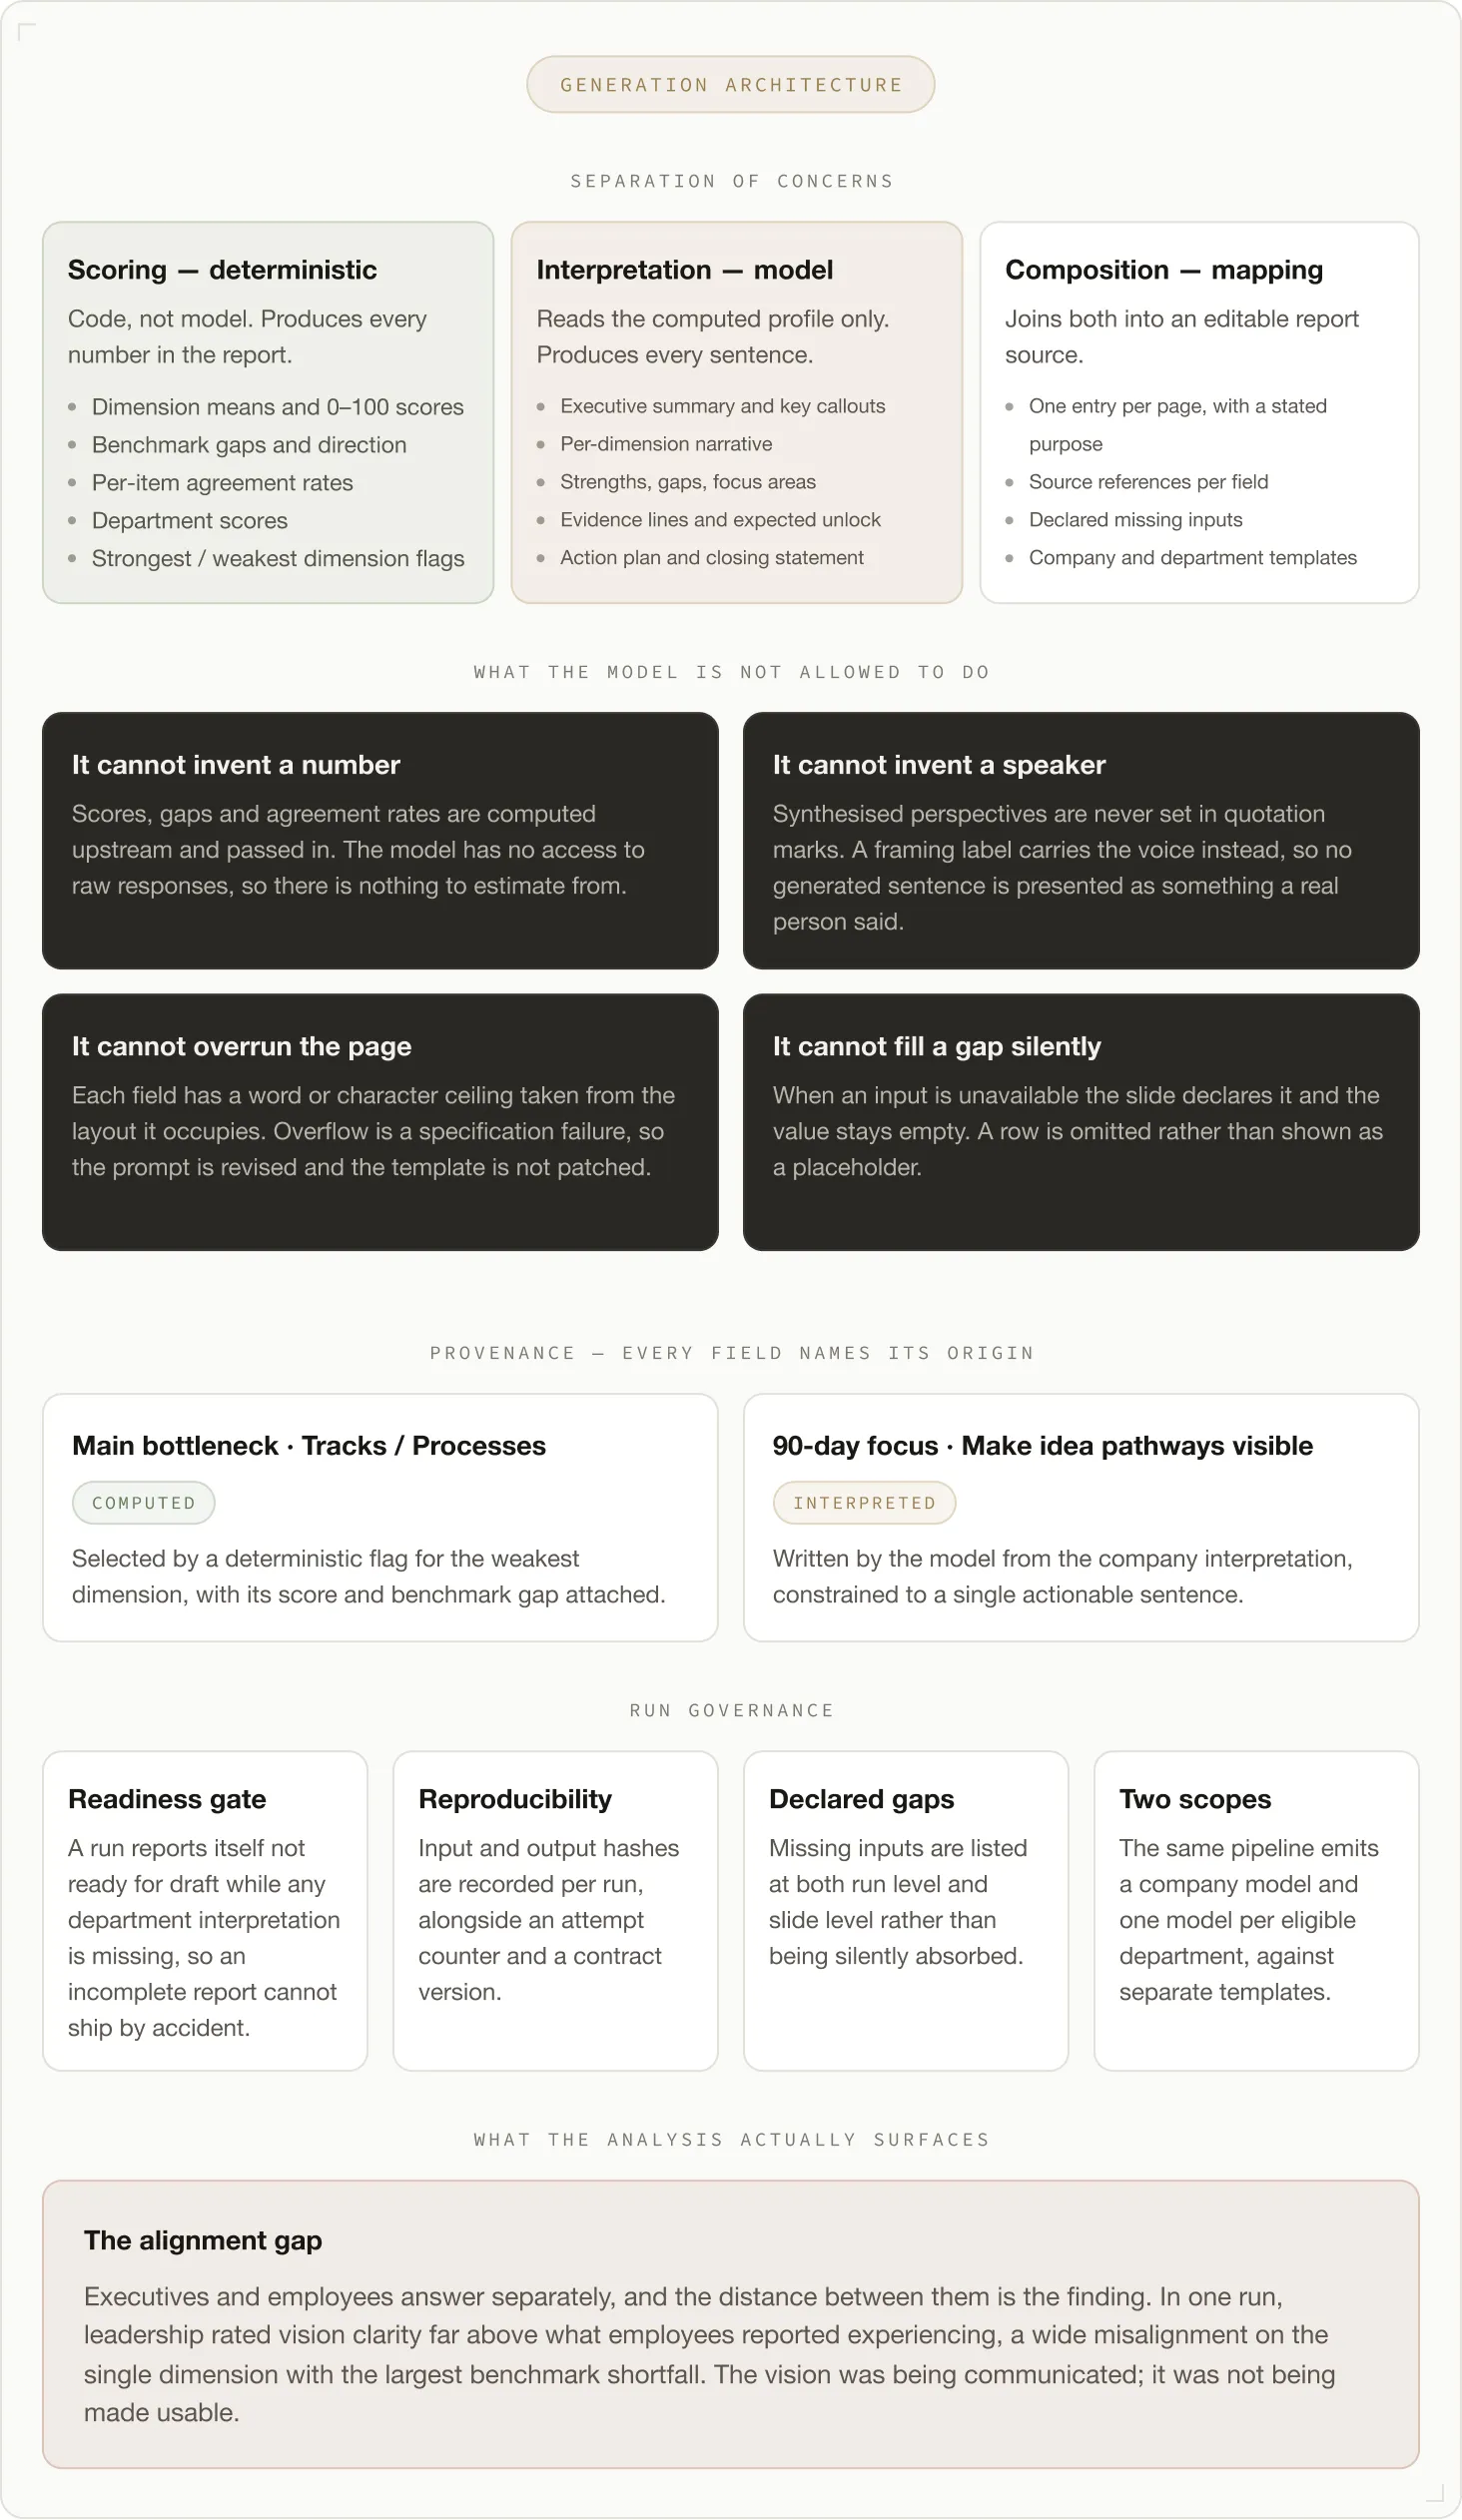
Every report is written per client, which means a language model drafts the prose. The governing decision was to separate the arithmetic from the argument completely: scoring is deterministic code, interpretation is the model, and the two meet only at composition time.

Deterministic scoring turns survey responses into means, 0–100 scores, benchmark gaps, per-item agreement rates, department scores and flags for the strongest and weakest dimension. The model never sees a raw response and never originates a number; it reads the computed profile and writes what it means. Composition then maps both into a slide-scoped source document, one entry per page.

That separation is what makes the output defensible. Every field in the report carries the layer that produced it, so a reader can always tell a measurement from an interpretation.

Diagram explaining a model’s generation architecture, constraints, provenance, governance, and alignment gap in reports.
MODULE 3.5
● Application Platform

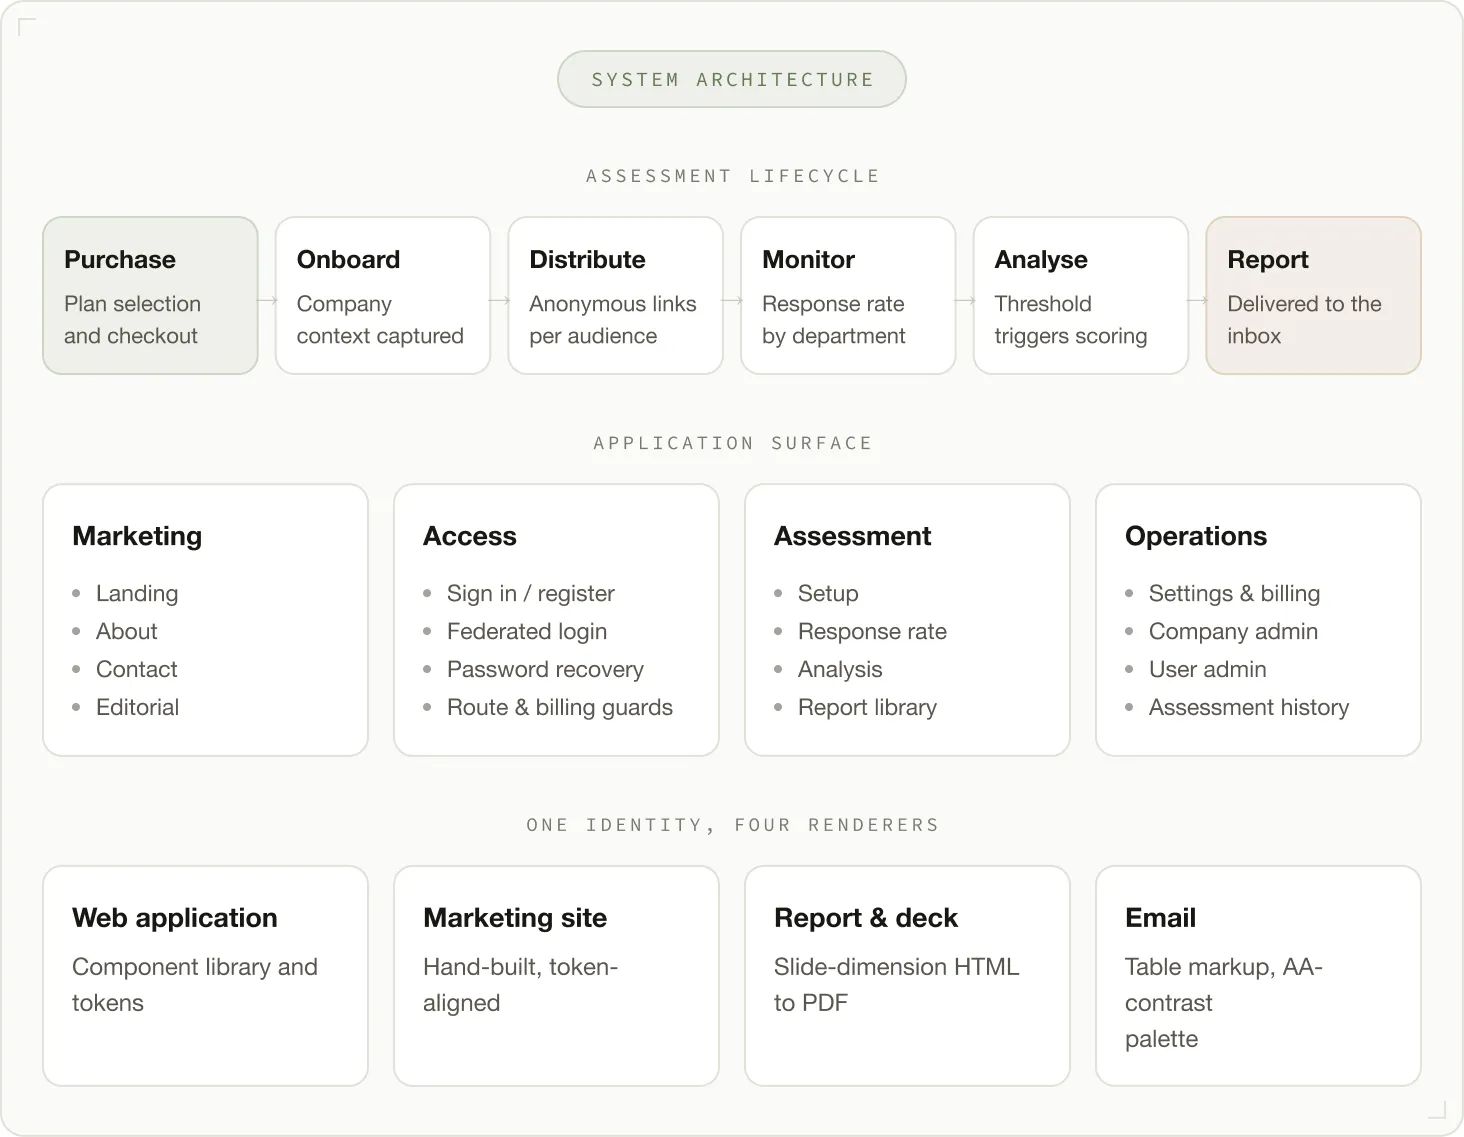
The customer-facing application covers the full commercial path: marketing, authentication, plan selection and checkout, assessment setup, live response-rate monitoring, analysis and the report library. All of it sits behind route guards, a billing gate and a content layer keyed by section, so copy can change without touching components.

Diagram of system architecture showing assessment lifecycle, application surface, and four rendering platforms.
04
STEP 04 — RESULTS

Delivered Impact

MODULE INVENTORY (5 COMPONENTS)
Instrument, Not
Interface
Positioning
A visual language that reads as
measurement rather than software
marketing, and survives a boardroom
projector.
Computed vs
Written
Governance
Numbers come from code,
sentences come from the model,
and every field on the page
eclares which.
Forwardable
Output
The deliverable leaves the platform
intact, presented and then passed on,
without anyone reformatting it.
PERFORMANCE OUTCOMES
A
#checked
Turned a research model into a commercial product surface: brand, application, report system and lifecycle communication
A
#checked
Rebuilt the client's core deliverable from a slide-tool document into a structured, board-ready diagnostic system
A
#checked
Established a brand identity with documented rationale, asset kit and misuse guidance the client can hold to
A
#checked
Extended design-system discipline into machine-generated language, adding length ceilings, locked tone and honest attribution, so per-client reports stay on-layout and on-voice
ASSEMBLY PHILOSOPHY
We don't just code.
We build systems.
Piece by piece,
designed to snap perfectly
into your vision.
#dot-circle
#dot-circle
#dot-circle
#dot-circle